
Comsysto Reply is a Grafana Labs Channel Partner.
The Grafana Labs Marks are trademarks of Grafana Labs, and are used with Grafana Labs’ permission.
We are not affiliated with, endorsed or sponsored by Grafana Labs or its affiliates.
From monitoring to business intelligence
Simply displaying metrics is no longer enough today. In the age of complex, cloud-native distributed systems, it is crucial to immediately understand the “why” rather than dwelling on the “what.” We establish observability that prioritizes proactivity and continuous learning. Our assessment helps make this happen.
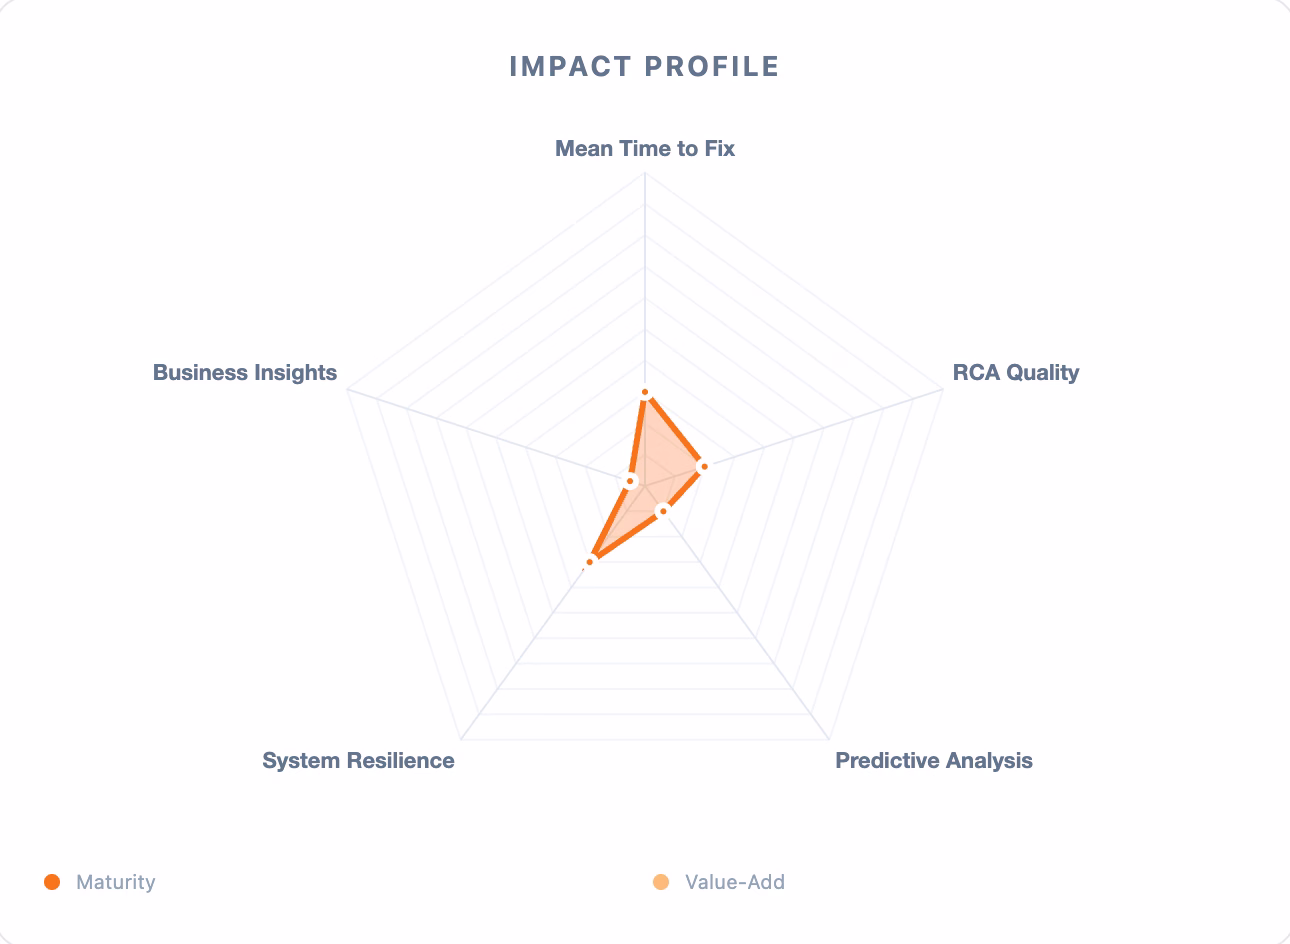
A narrow focus on technical KPIs such as uptime, CPU load, or “number of exceptions in the logs”.
What your monitoring can do: “The server is down.”
Allows for
- purely reactive action.
- fixing technical components instead of maintaining a service.
- simple system-related threshold alerts detection of known issues after they occur.
Monitoring is a cost center.
Metrics and logs can be displayed side by side and correlated.
What your monitoring system can do: “Latency is high, and a repository is generating many errors.”
Allows for
- proactive action through expanded context and alerting, but: the focus remains on the technology.
- breaking down silos, thereby enabling telemetry correlation.
- adaptive thresholds based on days of the week/load profiles.
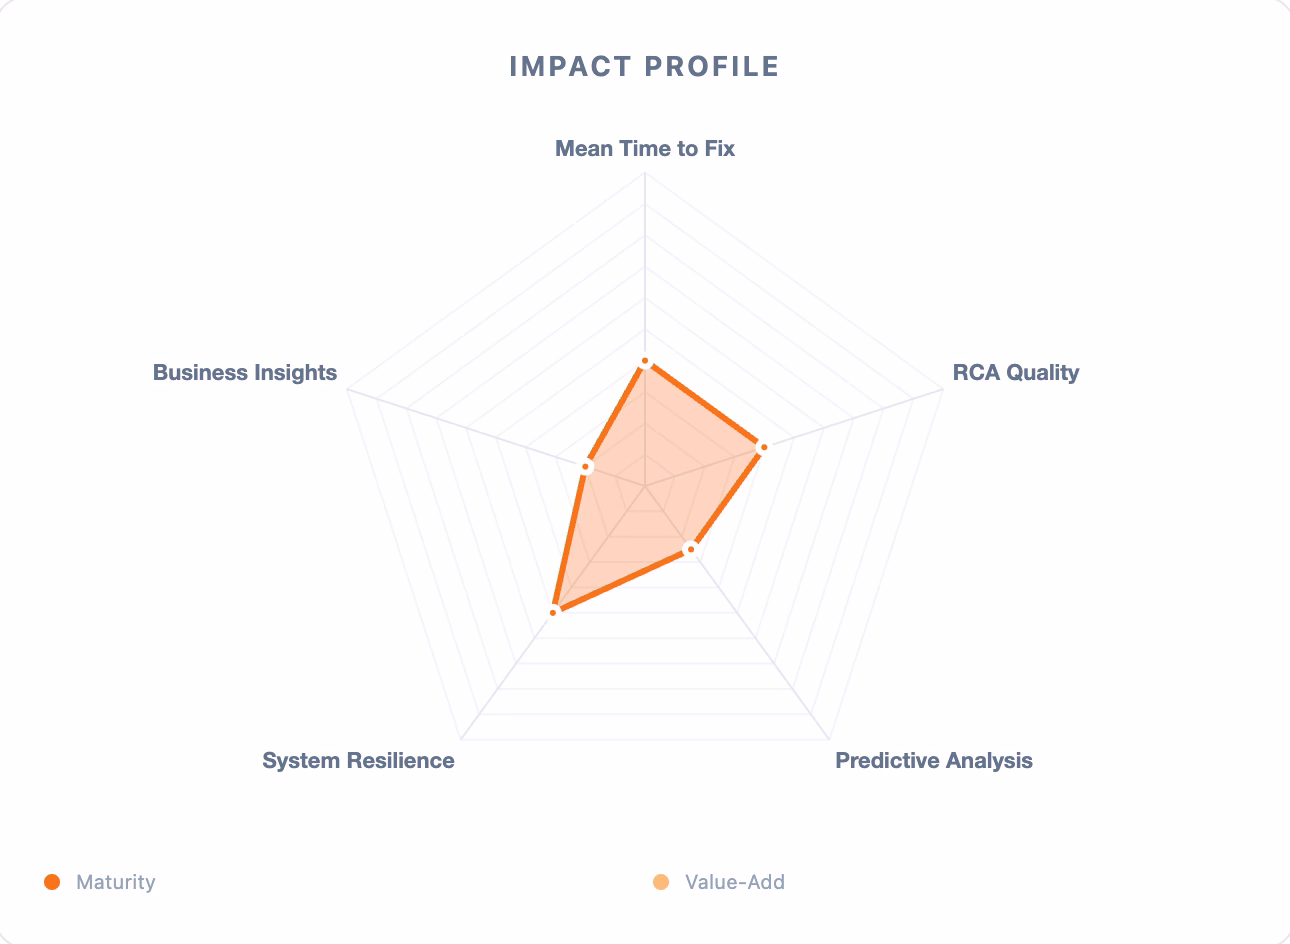
Automatic correlation of telemetry through centralized storage in a shared context.
What your monitoring can do: “Latency for iOS users in Berlin has increased since the last deployment.”
Allows for
- proactive, correlated action through context-rich data analysis across all telemetry data in a centralized view.
- graphical root cause analysis with drill-down functionality and filtering across various dimensions.
- consolidation of app performance and technical KPIs in Grafana.
- AI suggests likely sources of error.
- dramatic reduction in analysis time.
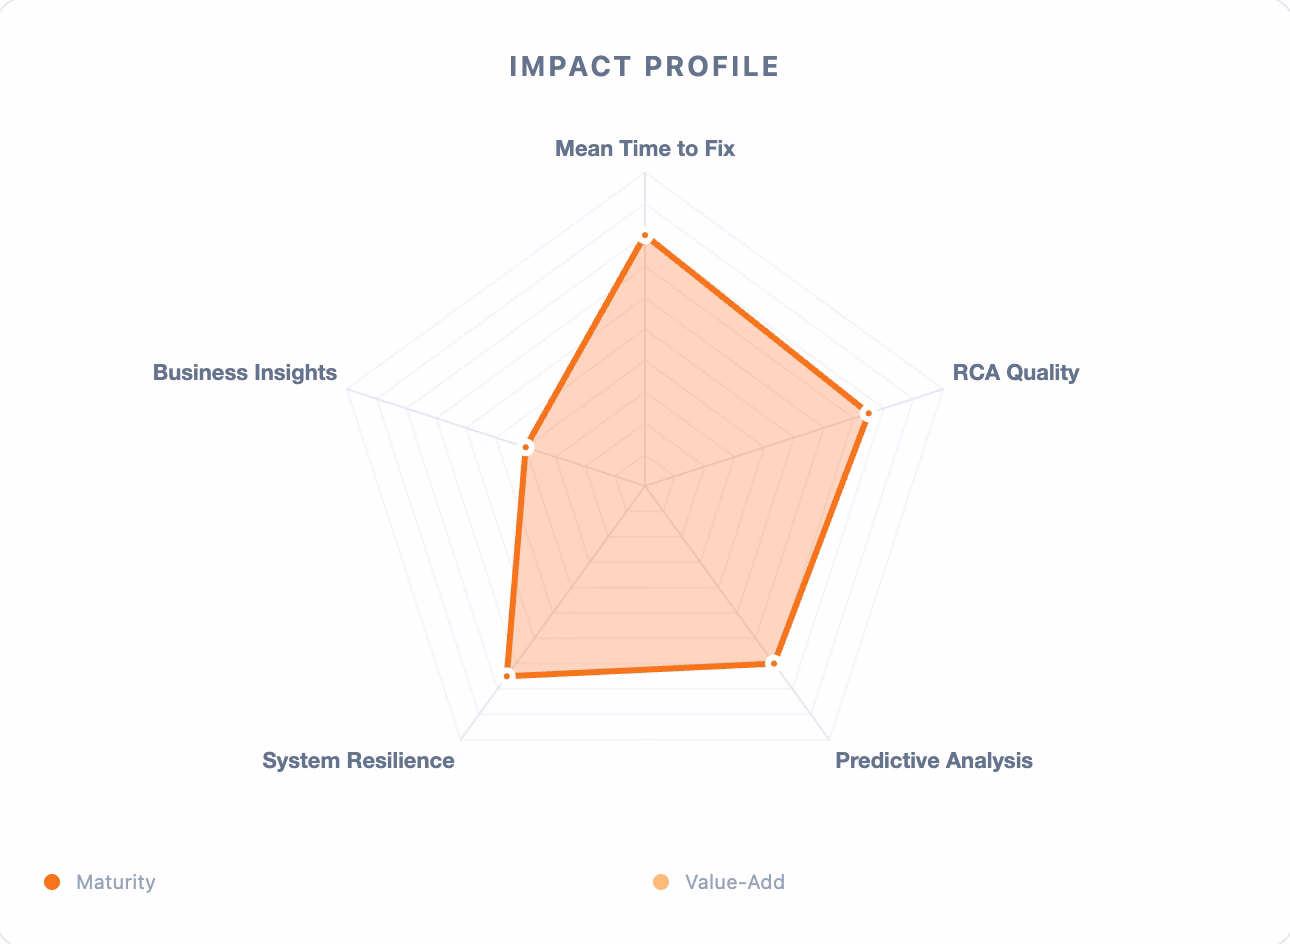
AI-powered, real-time telemetry analyses enriched with business knowledge, directly from the observability stack.
What your monitoring can do: “Revenue from Android users has dropped by 15% in the last 24 hours. Our website no longer seems to be functioning properly due to a new browser version.”
Allows for
- correlation of system health with transaction rates and user engagement.
- semi-autonomous or fully autonomous incident creation.
- defines recommended actions for the team. Informs stakeholders about current developments.
- real-time business decisions based on AI-generated telemetry trends.
AI & telemetry: Towards a "self-healing" business
Our three-step approach guides you along this journey, no matter where you are today or how far you want to go. It consists of:
- 60-minute Observability Assessment to create a roadmap for leveling up
- A two-day architectural review for hands-on support and greater clarity on exactly what needs to be done
- Expert consulting tailored to Grafana and the LGTM stack, for as long as needed

Our recipe for success
DevOps integration
Infrastructure as Code. We provision dashboards and alerts automatically. No manual clicks, full reproducibility.
Grafana Cloud Enterprise
Scalable, secure backends for telemetry. Role-based and label-based access control (RBAC and LBAC) and integration with SSO/SAML.
We start where you are
Always with a clear and achievable goal in mind.
Ready for real insights?
Schedule a no-obligation consultation and unlock your hidden potential!
Request an appointment